It can be hard to get a handle on all the economic data that is continuously being released, and even worse, they can often send conflicting signals. One approach is to combine several indicators that typically give you an early warning signal about economic turning points into a single indicator, i.e. a “leading economic index” (LEI).
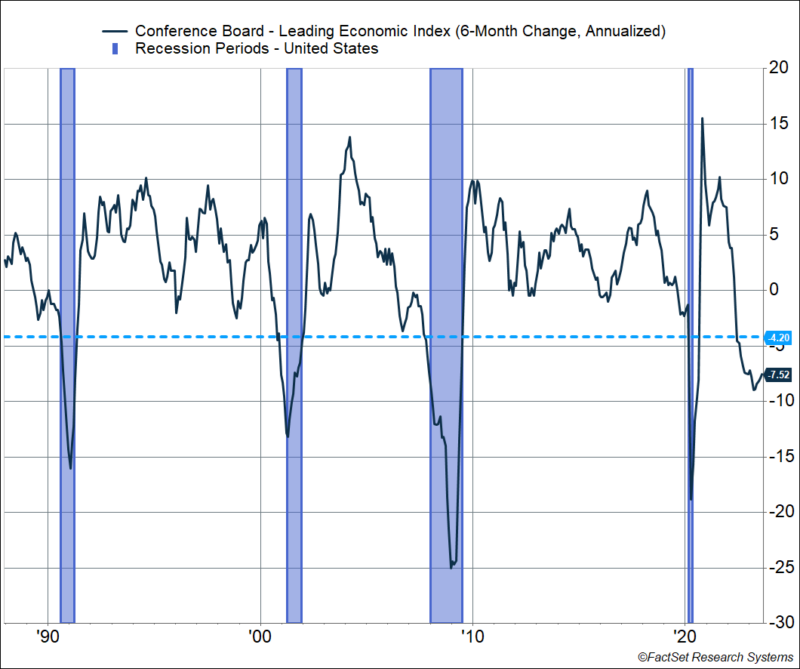
The most popular LEI is the Conference Board’s, and the latest release showed it dropping 0.4% in August. That makes it 17 straight months over which this index has fallen. Over the past 6 months, it’s fallen at an annual pace of 7.5%, keeping it below the recessionary threshold of -4.2%. Historically, anything below -4.2% has foreshadowed recessions – as you can see in the chart below.
The Conference Board’s LEI has been below the recessionary threshold since June of last year. In other words, the LEI has been pointing to a recession for 14 months now. But there’s been no sign of a recession so far.
Solid Growth Despite LEI Signal
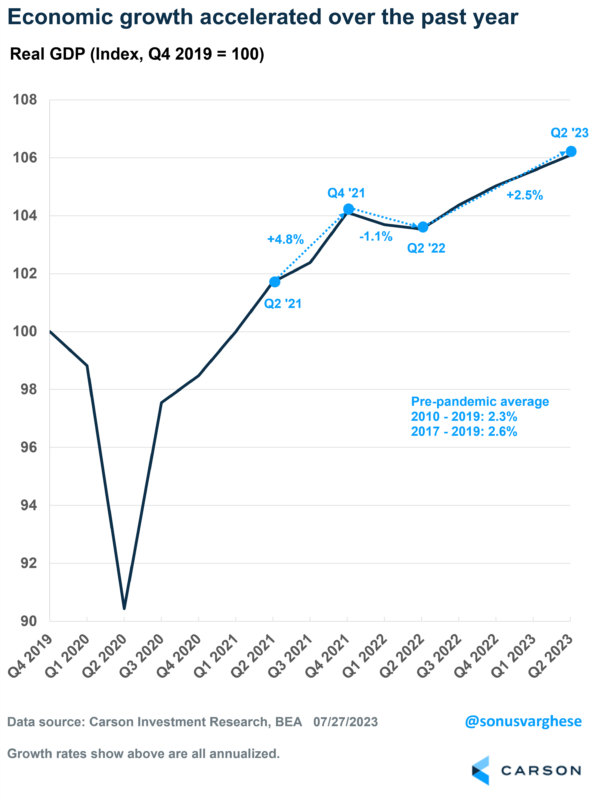
Not only has the economy not gone into a recession, but it’s also actually grown 2.5% over the past year (after adjusting for inflation). That’s faster than the average pace of growth over the past decade, when growth averaged 2.3% a year.
Why Is the Conference Board’s LEI So Off?
It helps to look under the hood of macroeconomic data. The LEI has 10 components, of which
- 3 are financial market indicators, including the S&P 500, and make up 22% of the index
- 4 measure business and manufacturing activity (44%)
- 1 measures housing activity (3%)
- 2 are related to the consumer, including the labor market (31%)
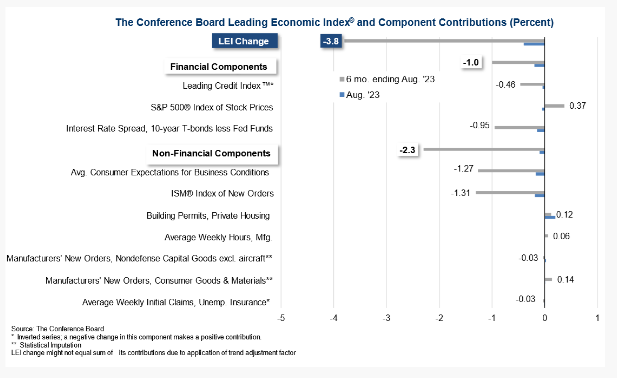
The chart below shows how these various indicators have pulled the index down over the past 6 months. The biggest drags are:
- Credit conditions, which are tight thanks to an aggressive Federal Reserve (Fed)
- Interest rate spreads, also thanks to the Fed
- Consumer expectations for business conditions
- ISM PMI for manufacturing new orders, which is a survey of purchasing managers in the manufacturing industry
It’s quite baffling why any of the above should tell you much about an economy that largely relies on household consumption. This Conference Board’s approach is premised on the belief that the manufacturing sector and business activity/sentiment, are leading indicators of the economy. This worked well in the past but is probably not indicative of what’s happening in the economy right now. For one thing, the manufacturing sector makes up just about 11% of GDP. Consumption makes up 68% of the economy, and we believe it’s important to capture that.
Carson’s Proprietary LEI Points to Above Trend Growth
We create a leading economic index for 30 different countries across the world. Each one is custom built to capture the dynamics of those economies and we roll them up to form an aggregate measure for different regions (example, developed and emerging markets) and the world overall. It is an important piece of the puzzle as we form our Carson House Views since it encapsulates a lot of significant macroeconomic information. Though I do want to stress that it is only one input into our asset allocation, portfolio, and risk management decisions. Our process also has other pillars such as monetary and fiscal policy, technical factors, and valuations.
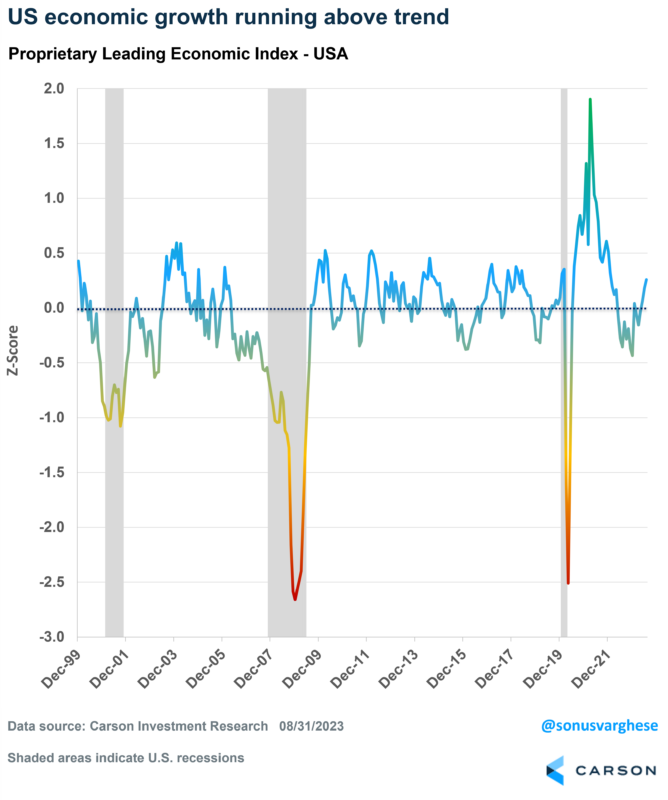
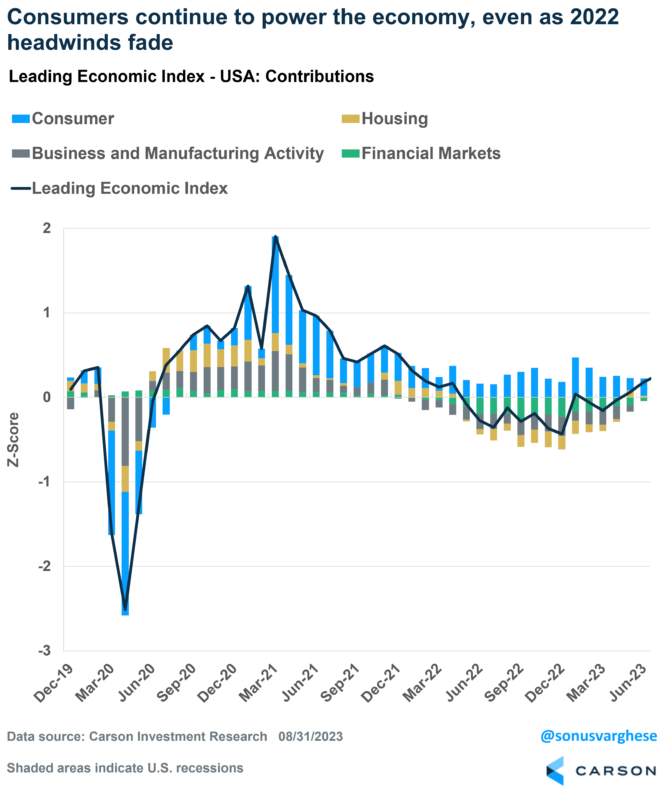
Our proprietary leading economic index for the US has not pointed to a recession at any point over the last year. The odds of a recession did increase during the latter half of 2022, when the Fed was aggressive with their interest rate hikes. However, recession odds have fallen this year, and right now, our LEI points to above-trend economic growth.
Headwinds From 2022 Are Fading
In contrast to the Conference Board’s measure, our LEI for the US includes 20+ components, including
- Consumer-related indicators (which make up 50% of the index)
- Housing activity (18%)
- Business and manufacturing activity (23%)
- Financial markets (9%)
To give you a sense of these, the consumer-related data includes initial claims for unemployment benefits, weekly hours worked, and vehicle sales. Housing includes indicators like building permits and new home sales.
The chart below shows a close-up view of the last three and half years, illustrating how the various components have added or dragged from the headline amid the Covid-related economic pullback and subsequent recovery. You can see that consumer indicators have held strong over the past year, and in fact, have strengthened a bit in 2023.
Last year, the main risk of a recession was an aggressive Fed, and rising rates adversely impacted financial markets, housing, and business and manufacturing activity.
What’s interesting now is that the big headwinds that dragged the index lower in 2022 are now fading:
- Financial conditions are improving as the Fed looks close to being done
- Housing activity is no longer crashing, and new home sales and permits have been rising
- Business investment and manufacturing activity are showing signs of bottoming out
All this is happening while labor markets remain strong. On Thursday, the labor department released data showing initial claims for unemployment benefits dropped to the lowest level since January, pointing to a labor market that remains healthy. This means incomes are likely to remain strong and continue to power consumption.

Stay on Top of Market Trends
The Carson Investment Research newsletter offers up-to-date market news, analysis and insights. Subscribe today!
"*" indicates required fields
We came into this year believing that the economy can avoid a recession, which was in sharp contrast to most other economists’ predictions. The data since then has validated our view, and at this point, the odds of a recession appear lower than they were nine months ago. The outlook for cyclical activity, including housing and manufacturing, looks better now. This is something Ryan Detrick and I discussed with Paul Hickey Co-Founder, Bespoke Investment group and Bespoke Market Intel on our latest Facts vs Feelings episode. We were joined by Sam Ro, CFA, Founder of TKer.co and Frank Cappelleri, Founder and President at CappThesis, in the episode we title “The Mega-Pod”. Take a listen below:
1910917-0923-A


