“If Santa should fail to call, bears may come to Broad and Wall.”
—Yale Hirsh
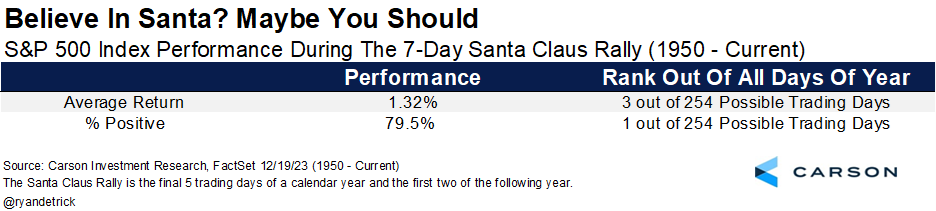
One of the little-known facts about the Santa Claus Rally (SCR) is that it isn’t the entire month of December; it’s actually only seven days. Discovered in 1972 by Yale Hirsch, creator of the Stock Trader’s Almanac (carried on now by his son Jeff Hirsch), the real SCR is the final five trading days of the year and first two trading days of the following year. In other words, the official SCR is set to begin tomorrow, Friday, December 22, 2023.
Historically, it turns out these seven days indeed have been quite jolly, as no seven-day combo is more likely to be higher (up 79.5% of the time), and only two combos have a better average return for the S&P 500 than the 1.32% average return during the official Santa Claus Rally period.
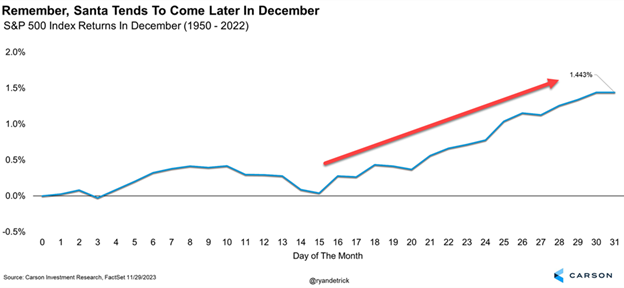
Here’s a chart we shared at the start of the month, showing that the latter half of December is when most of the seasonally strong gains occur. Of course, this year is anything but normal, with huge gains the first part of the month.
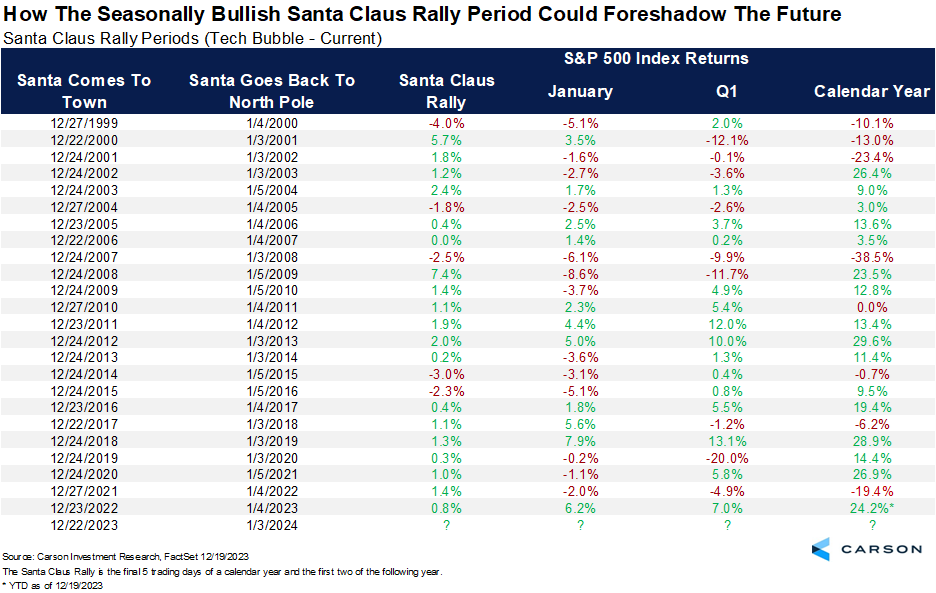
These seven days tend to be in the green, so that is expected. But fun trivia stat, the SCR has been higher the past seven years and hasn’t been higher eight years in a row since the ‘70s. The all-time record was an incredible 10-year winning streak in the ‘50s and ‘60s. Here we show all the SCR periods since the tech bubble and how the S&P 500 does after each.
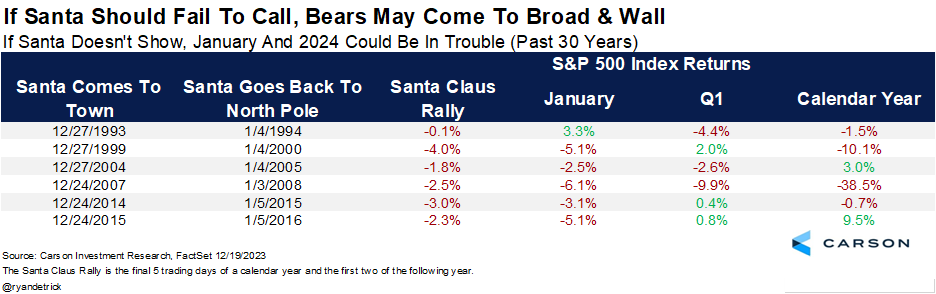
The bottom line is that what really matters to investors is when Santa doesn’t come, as Mr. Hirsch noted in the quote at the start of this blog.
Stay on Top of Market Trends
The Carson Investment Research newsletter offers up-to-date market news, analysis and insights. Subscribe today!
"*" indicates required fields
Here we show some recent times investors were given coal during these seven days, and the results after aren’t very good at all. The past five times (going back 30 years) that the SCR was negative saw January down as well. Notably, there was no SCR in 2000 and 2008, not the best times for investors, and potentially some major warnings that something wasn’t right. Lastly, the full year was negative in 1994 and 2015 after no Santa. We like to say in the Carson Investment Research team that hope isn’t a strategy, but I’m hoping for some green during the SCR!
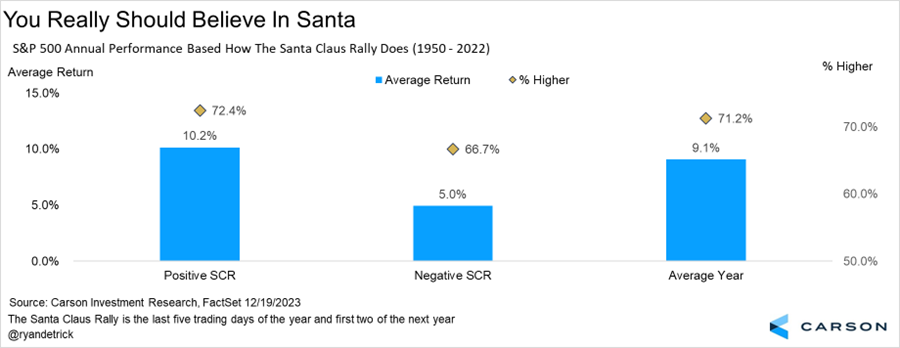
Finally, the average gains each year for the S&P 500 is 9.1% and the index is higher 71.2% of the time. But when there is an SCR, those numbers jump to 10.2% and 72.4%, falling to only 5.0% and 66.7% when there is no Santa. Sure, this is only one indicator, and we suggest following many more indicators to base your investment decisions, but this is clearly something we wouldn’t ignore either.
The bottom line is stocks are at or near all-time highs, we’ve been quite vocal about why stocks would do well this year, and we don’t see any major reasons not to expect Santa to come once again in 2023. I discussed why we remain bullish with Brian Sullivan recently on CNBC’s The Last Call.
For more of Ryan’s thoughts click here.
02035762-1223-A
